

Most daycare management software throws dozens of metrics at you. Attendance percentages, inquiry conversion rates, staff turnover calculations, revenue per child, cost per meal, supplies per classroom... it's exhausting. What actually matters comes down to about 8 metrics that directly connect to decisions you can make tomorrow morning.
The problem isn't tracking data—modern daycare software collects everything. The problem is knowing which numbers actually predict problems before they hurt your business. A 3% drop in weekly enrollment might mean nothing. Or it might signal you're about to lose $4,000 monthly when three more families leave. The difference? Understanding which metrics trigger which actions.
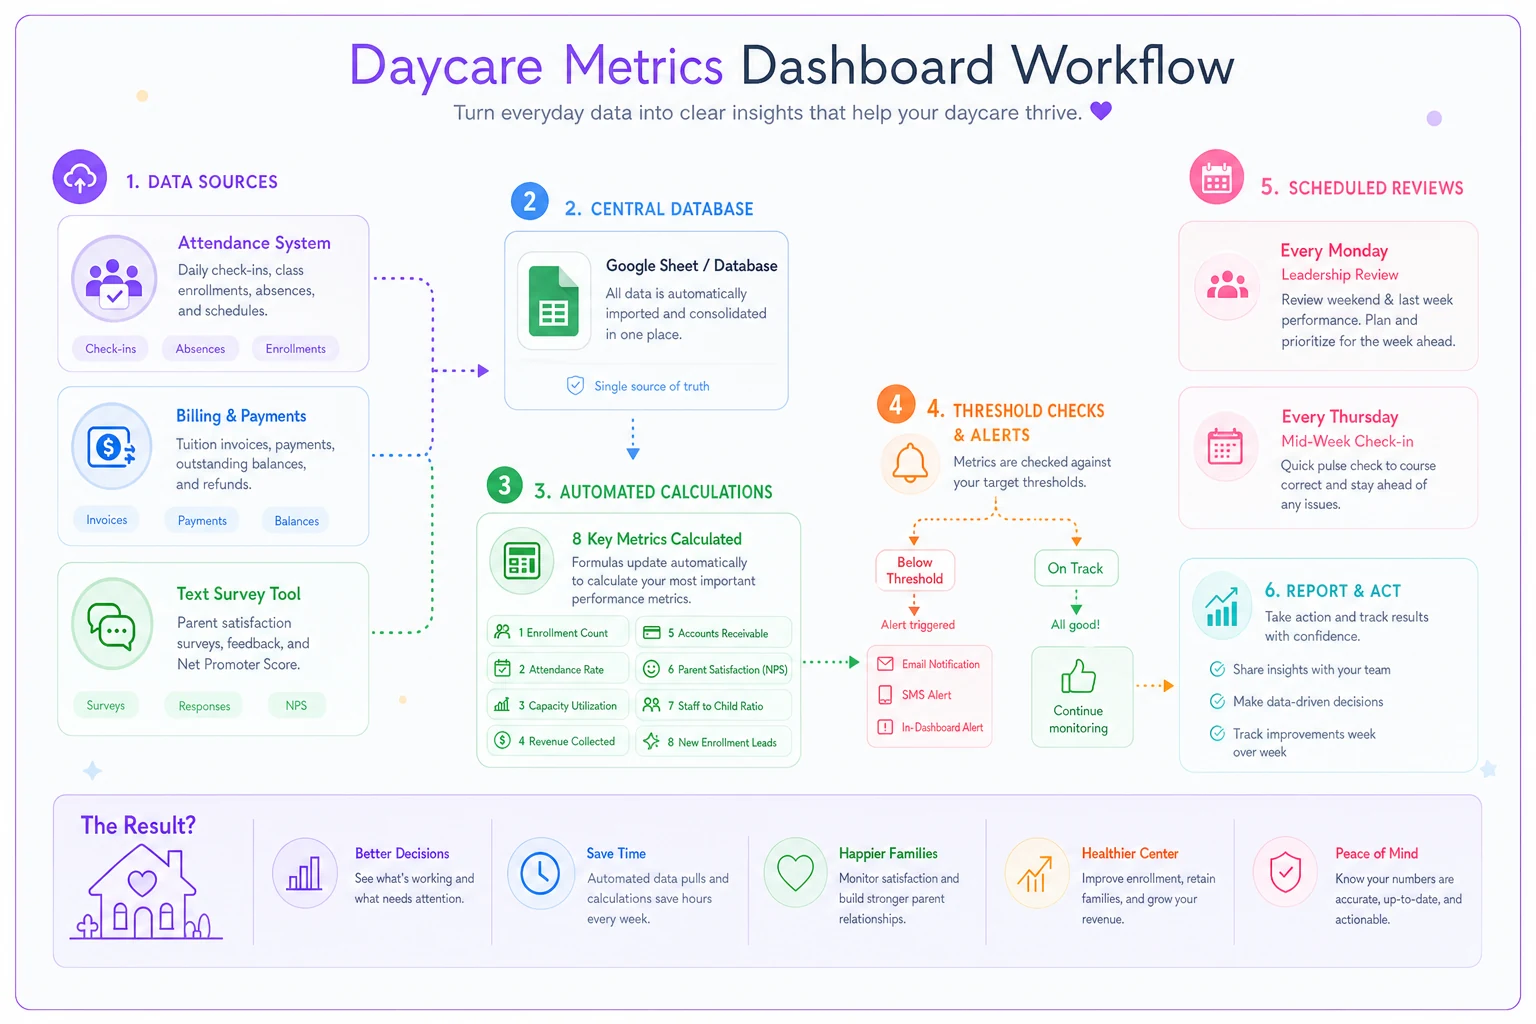
The 8 metrics framework (and why this specific set works)
After analyzing operations across roughly 300 daycare centers, from 25-kid home daycares to 180-kid multi-site operations, a pattern emerges. Centers that track everything struggle just as much as centers that track nothing. But centers tracking these specific 8 metrics? They catch problems 2-3 weeks earlier and actually fix them.
Utilization Rate measures how full your licensed capacity actually is. Not enrollment—actual butts in seats daily.
Weekly Cash Position tracks your operational cushion, not your P&L.
Family Satisfaction Score (collected weekly, not annually) catches problems while you can still fix them.
Staff Coverage Efficiency shows whether you're overstaffed at 2pm and understaffed at 7am.
Waitlist Conversion Rate tells you if families are actually interested or just placeholder shopping.
Collection Rate reveals payment problems before they compound.
Regulatory Compliance Score prevents surprises during inspections.
Cost Per Child Day combines all your operational costs into one comparable number.
Each metric needs three things to be useful: a clear calculation method, a specific threshold that triggers action, and a dashboard view that makes problems obvious. Generic benchmarks won't work—your thresholds depend on your specific market, building costs, and business model.
Utilization Rate: The difference between 82% and 87% is massive
Utilization reveals the truth about daycare operations. You're licensed for 60 kids. You have 54 enrolled. That's 90% enrollment, which sounds healthy. But when you track actual daily attendance, you discover you're averaging 47 kids per day. That's 78% utilization. The gap between enrollment and utilization is where profit disappears.
Eliminate administrative bottlenecks.
Carexly helps you manage enrollments, attendance, and staff schedules effortlessly.
- Streamlined child enrollment
- Automated parent notifications
- Staff shift and activity scheduling
No credit card required
Calculation: (Average Daily Attendance / Licensed Capacity) × 100
-
Below 75%
Review your enrollment process and waitlist management immediately
-
Below 70%
Consider reducing operating hours or consolidating classrooms
-
Above 95%
Start actively expanding capacity or raising rates
Dashboard View: A simple line graph showing daily utilization for the past 30 days, with your threshold marked as a red line. Add a second line showing enrollment percentage so you can see the gap.
Most centers discover their utilization runs 8-12% below enrollment. That gap represents families paying partial fees, excessive sick days, or informal schedule arrangements that hurt revenue. One center in Michigan thought they were at 88% capacity until they tracked actual utilization—turned out they were at 71%. They were staffing for enrolled numbers, not attending numbers. Fixed that, saved $3,400 monthly in unnecessary staff costs.
Update the utilization dashboard daily, but review it weekly. Monday morning, first thing. If you're below threshold for 3 consecutive days, that's when you act. Not after a full week of low numbers.
Weekly Cash Position: Why monthly P&L reports are too slow
Cash position isn't about profitability—it's about whether you can make payroll in 10 days. Daycare centers fail with positive P&L statements all the time because cash timing kills them. Parents pay late, insurance bills hit unexpectedly, that HVAC repair can't wait.
Calculation: (Cash on Hand + Expected Collections This Week - Required Payments This Week)
-
Below 2 weeks operating expenses
Accelerate collections immediately
-
Below 1 week
Consider short-term financing options
-
Above 6 weeks
Opportunity for equipment upgrades or bonuses
Dashboard View: A bar chart showing your cash position for the next 4 weeks based on known receivables and payables. Color code: green (>4 weeks), yellow (2-4 weeks), red (<2 weeks).
Track this every Monday and Thursday. Not daily—that'll drive you crazy. Not monthly—that's how surprises happen. Twice weekly gives you enough warning to adjust payment collection or delay non-critical expenses.
A center in Arizona learned this lesson hard. Their P&L showed $8,000 monthly profit. But they tracked cash monthly, not weekly. Didn't notice that their biggest corporate client (12 kids) had quietly extended payment terms from 15 to 45 days. Nearly missed payroll before catching it. Now they track cash position every Monday and Thursday morning. Takes 5 minutes with the right dashboard setup.
Family Satisfaction Score: Weekly pulse checks beat annual surveys
Annual parent surveys are basically useless for operations. By the time you get feedback, families have already decided to leave. Weekly pulse checks—one simple question—catch issues while you can still fix them.
Calculation: "How likely are you to recommend our center to a friend?" (0-10 scale, calculate average)
-
Below 7
Immediate follow-up with any family scoring below 6
-
Below 6
All-hands meeting to address service issues
-
Consistent scores below 8
Review your value proposition and pricing
Dashboard View: A trend line showing weekly average scores for past 12 weeks, with individual low scores highlighted for follow-up.
Send this every Friday at 2pm via text message. Not email—response rates tank. Not paper—nobody fills them out. One question, text message, takes 5 seconds to answer. You'll get 60-70% response rates.
Operational software automation makes automatic follow-up triggers possible. Family scores below 6? Director gets an alert Monday morning with the family name and their child's teacher. Score drops two weeks in a row? Automatically schedule a check-in call. This kind of proactive intervention keeps families from quietly shopping other centers.
A center outside Dallas implemented weekly pulse checks after losing 8 families in one month. Turned out their afternoon teacher in the 3-year-old room had been consistently late from lunch, leaving the morning teacher frustrated and the room chaotic during pickup. Parents noticed but didn't complain—they just left. Weekly pulse checks would've caught that problem in week one, not after two months of families quietly getting frustrated.
Staff Coverage Efficiency: The metric that fixes your ratios AND your payroll
You're probably measuring staff turnover and ratios. But coverage efficiency tells you something more useful: are the right people in the right rooms at the right times? Most centers are overstaffed from 12-3pm and understaffed from 6:30-8:30am. That's not a hiring problem—it's a scheduling efficiency problem.
Calculation: (Required Staff Hours Based on Ratios / Actual Staff Hours Worked) × 100
-
Below 85%
Immediate schedule restructure needed
-
Below 80%
Consider split shifts or part-time positions
-
Above 95%
Risk of ratio violations during breaks/transitions
Dashboard View: Heat map showing efficiency by hour across the week. Red spots show overstaffing, blue shows understaffing risks.
This metric reveals expensive patterns. Like that Friday afternoon when you have 4 teachers for 11 kids because everyone's scheduled their full hours but families leave early. Or Monday morning when you're scrambling because three teachers consistently arrive at 7:01 for a 7:00 shift, leaving one person managing dropoff chaos.
One center in Ohio thought they needed to hire two more full-time teachers. Ran the coverage efficiency numbers and discovered they were at 73% efficiency—basically paying for 37 extra hours weekly that weren't needed. Restructured schedules, added two part-time floaters instead of full-time teachers, saved $4,100 monthly. Their AI-powered scheduling system now automatically adjusts based on historical attendance patterns, keeping efficiency between 85-90%.
Review this metric every two weeks, not weekly. Daily variations are normal. It's the patterns you're looking for. When you find problems, fix the schedule structure, not just next week's assignments.
Waitlist Conversion Rate: The truth about your pipeline
Every center has a waitlist. But most waitlists are fantasy. Parents put their names down at 5 centers, pick one, never tell the other 4. Your "waitlist of 30 families" might actually be 6 real prospects. Conversion rate tells you the truth.
Calculation: (Families Who Enrolled From Waitlist / Total Waitlist Contacts Made) × 100
-
Below 20%
Your waitlist is stale, needs complete refresh
-
Below 10%
Stop counting waitlist in capacity planning
-
Above 40%
Opportunity to increase rates or be more selective
Dashboard View: Funnel showing waitlist size → contacted → toured → enrolled, with conversion rate at each stage.
Track this monthly, but take action weekly. Every Monday, your enrollment coordinator should contact 5 waitlist families. Not email—actual phone calls. "Hi, just checking if you're still interested. We might have a spot opening next month." You'll quickly learn who's real and who disappeared six months ago.
A center in Colorado had 47 families on their waitlist. Felt secure about filling spots. Then two families gave notice. They called all 47 waitlisted families. Three answered. One was interested. They had been counting ghosts. Now they track conversion actively and keep their waitlist fresh—any family that doesn't respond to two check-ins gets removed.
Collection Rate: The early warning system for cash problems
This isn't about total revenue—it's about timing. A 95% collection rate sounds good until you realize that 5% represents $6,000 that's 30+ days late, and it's growing each month.
Calculation: (Payments Collected On Time / Total Payments Due) × 100
-
Below 92%
Review payment policies and late fee enforcement
-
Below 88%
Implement autopay requirements for new families
-
Below 85%
Consider requiring credit card on file for all families
Dashboard View: Aging report showing 0-7 days, 8-14 days, 15-30 days, 30+ days overdue, with family names in each bucket.
Check this every Thursday afternoon. Not Monday—people are busy. Not Friday—you can't follow up over the weekend. Thursday gives you time to make collection calls and process payments before the week ends.
The operational software piece here is automation of reminders and escalation. First late payment: automatic friendly text. Second: automated email with late fee notice. Third: system alerts director for personal call. This graduated response keeps relationships intact while improving collections.
Regulatory Compliance Score: Preventing expensive surprises
Compliance isn't just about passing inspections—it's about operating confidently. This metric turns compliance from a scramble into a system.
Calculation: (Completed Compliance Tasks / Total Required Tasks) × 100
-
Below 95%
Daily review until caught up
-
Below 90%
Assign dedicated staff to compliance catch-up
-
Below 85%
Consider compliance consultant or software upgrade
Dashboard View: Checklist showing all compliance requirements with due dates, completion status, and responsible person. Red items are overdue, yellow are due within 7 days.
Review this weekly, act on it daily. Every morning, someone checks what's due today. Fire drills, medication logs, ratio documentation, training certificates—it all needs tracking.
A center in Texas got hit with $4,500 in fines because three staff members' CPR certifications had expired. They had reminders on a paper calendar that got coffee spilled on it. Now their management platform tracks all certifications, sends alerts 30 days before expiration, and won't let expired staff clock in until updated. Zero compliance fines in 18 months since switching to automated tracking.
Cost Per Child Day: The number that reveals operational truth
This combines everything—staff, food, supplies, rent, utilities—into one comparable number. It's the fastest way to spot operational drift.
Calculation: Total Operating Costs / Total Child Days (enrolled children × days attended)
-
10% increase month-over-month
Immediate cost review required
-
Above market rate
Review pricing strategy
-
Below market rate
Possible quality or staffing concerns
Dashboard View: Line graph showing cost per child day over past 6 months, with breakdown of major cost categories stacked below.
Calculate this monthly, but track the components weekly. Food costs spiking? You'll see it in the weekly numbers before the monthly total shocks you.
Cost per child day varies dramatically by age group. Infants might cost $47/day while school-age costs $22/day. Blended averages hide problems. Track separately by classroom when possible.
The Monday morning dashboard routine
Every Monday at 8:30am, before the chaos starts, you review this dashboard:
| Metric | Check | Action If Below Threshold |
|---|---|---|
| Utilization Rate | Are we at threshold? | Review enrollment plan immediately |
| Weekly Cash Position | Can we make payroll? | Identify large payments coming |
| Family Satisfaction | Any scores below 6? | Schedule follow-up calls |
| Coverage Efficiency | Is schedule optimized? | Adjust this week's staffing |
Save the monthly reviews for waitlist conversion, cost per child day, full compliance review, and collection rate trends.
The Thursday check-in at 2pm covers collection status, cash position update, and compliance items due within 7 days.
This routine takes about 20 minutes Monday, 10 minutes Thursday. But those 30 minutes weekly prevent the surprises that kill daycare businesses.
Red flags across multiple metrics
Sometimes individual metrics look fine but the combination tells a different story.
Death Spiral Pattern: Utilization dropping + collection rate falling + family satisfaction declining = families leaving and taking friends
Cash Crunch Pattern: High utilization + low collection rate + rising costs = profitable on paper, broke in reality
Quality Slide Pattern: High coverage efficiency + declining satisfaction + increasing waitlist conversion = cutting too deep on staff
Growth Trap Pattern: Rising utilization + falling coverage efficiency + increasing compliance issues = growing too fast for your systems
When you see these patterns, don't wait for thresholds. Act immediately.
Building your actual dashboard (without enterprise software)
You don't need expensive enterprise software to track these metrics. Most centers can build this with Google Sheets and some basic automation. But modern AI-powered operational software really shines here—it pulls data automatically from your existing systems, calculates metrics in real-time, and sends alerts when thresholds are crossed.
The manual version: Export data weekly, update spreadsheets, check thresholds, create reminders. Takes about 2 hours weekly.
The automated version: Software pulls attendance from your check-in system, payments from your billing platform, satisfaction from text surveys, calculates everything automatically. Takes 20 minutes to review, zero minutes to maintain.
Start with one dashboard tab per metric and automations for the two weekly checks before automating everything.
Either way works. The key is consistency. Pick your eight metrics, set your thresholds, review on schedule. No exceptions.
What changes as you grow
At 30 kids, you can track these metrics in your head. At 60 kids, you need a spreadsheet. At 100+ kids or multiple sites, manual tracking breaks down. That's when operational software becomes essential—not just helpful, essential.
The metrics stay the same, but the thresholds adjust. Larger centers can tolerate lower utilization (more margin buffer). Multi-site needs site-specific dashboards plus consolidated views. Corporate clients change collection rate dynamics. More staff means coverage efficiency becomes critical.
One multi-site operator in Florida tracks these same 8 metrics across 4 locations. Each site director has their own dashboard, she has a consolidated view. Takes her 30 minutes every Monday to review all four locations, spot patterns, and deploy resources where needed. When Site 3's utilization dropped below 70%, she temporarily moved two teachers to Site 2 where utilization was pushing 95%. Saved one site from closure, prevented another from ratio violations.
Most daycare owners think growth means more kids. But sustainable growth means better metrics. A 50-child center with 90% utilization, 95% collection rate, and 88% coverage efficiency is more profitable than a 75-child center running at 70%, 85%, and 72%.
These 8 metrics aren't just numbers on a dashboard. They're early warning systems that buy you time. Time to fix problems before families leave. Time to adjust costs before cash runs out. Time to improve quality before reputation suffers. The daycare owners who make it past year three aren't necessarily better at childcare. They're better at spotting problems in week two instead of month two. That's what these metrics give you—time to act instead of react. Your dashboard doesn't need to be fancy. It needs to be honest, updated, and checked religiously. Every Monday morning, every Thursday afternoon. The same 8 metrics, the same thresholds, the same actions triggered. Because in daycare operations, like most small businesses, success isn't about perfection. It's about catching problems while they're still small enough to fix with a phone call instead of a layoff.
Ready to transform your daycare operations?
Join hundreds of daycare centers using Carexly to save time, improve communication, and enhance child care quality.