

Most daycare forecasts break down in the same spot: revenue gets projected off a hopeful occupancy number, payroll gets budgeted off "what we usually spend," and somewhere around the 20th of the month the owner realizes the two don't reconcile. There's a gap nobody planned for.
That gap is almost never a surprise in hindsight. It was baked in weeks earlier when three families gave notice, two infants aged up into a toddler room that was already staffed heavy, and nobody touched the schedule because nothing triggered the change. That's the whole point of daycare occupancy financial forecasting — not to make a budget, but to build something that reacts. When occupancy moves, you already know what happens to staffing and cash before payroll runs.
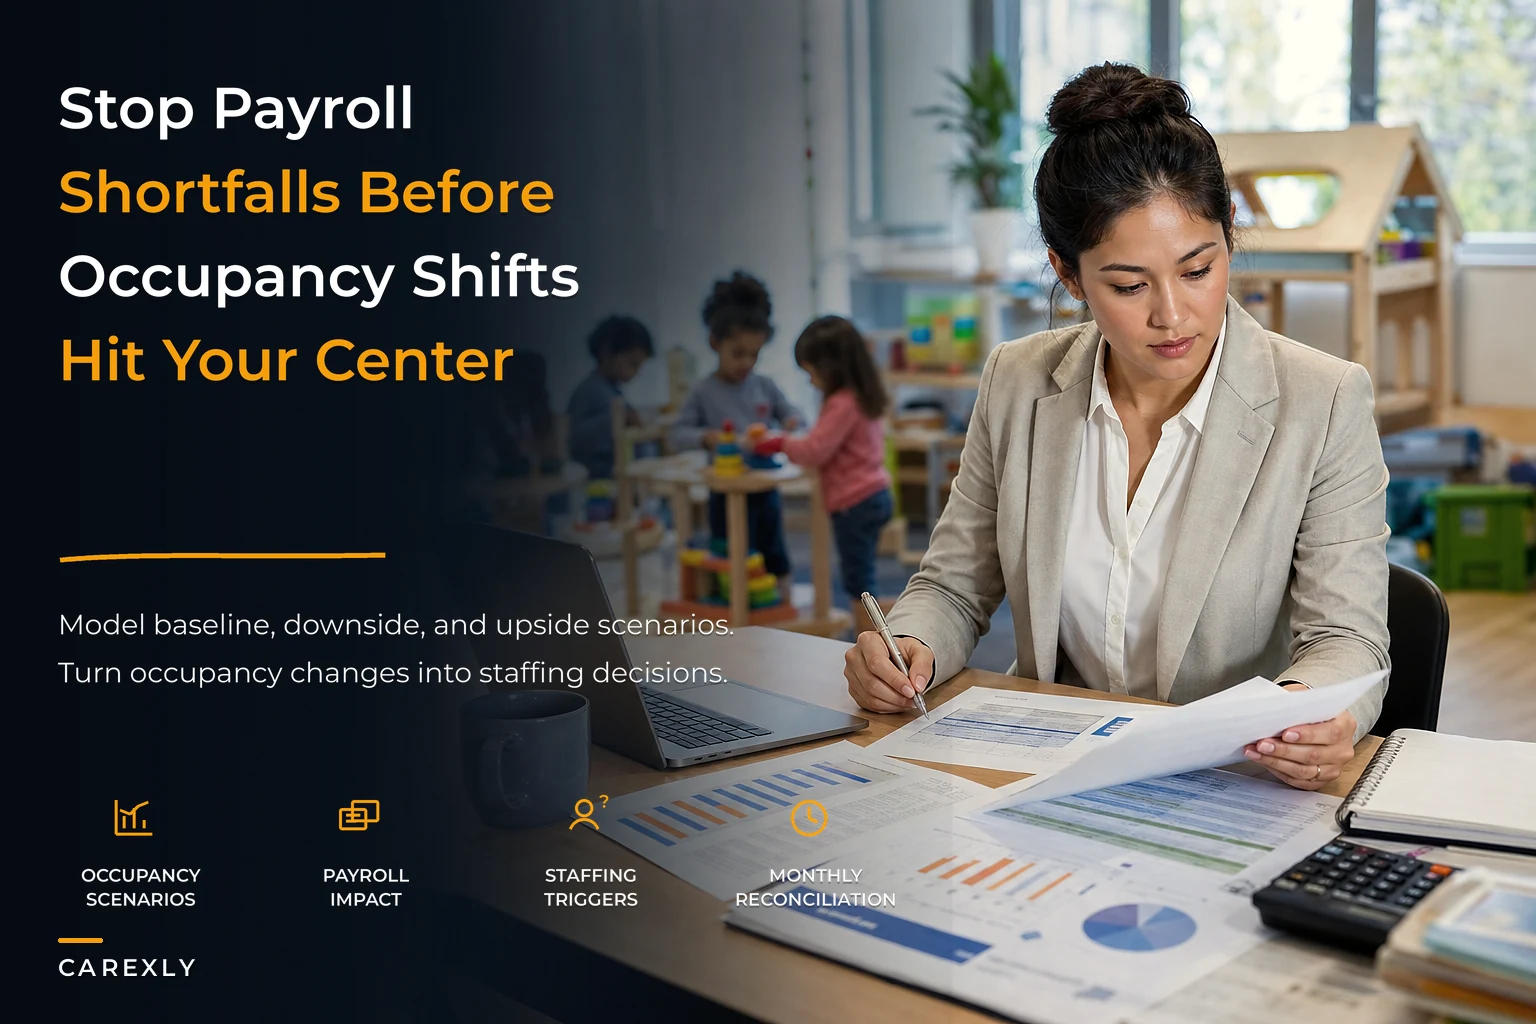
This post walks through that model: baseline, downside, upside — each tied to specific staffing actions and a monthly reconciliation ritual that catches drift before it turns into a shortfall.
Why payroll shortfalls are a forecasting failure, not a spending failure
When an owner tells me payroll "ran high" in a given month, the instinct is to blame overtime or a scheduling mistake. Sometimes that's it. But more often occupancy dropped and staffing didn't move with it. You were staffed for 78 kids and had 64 enrolled by mid-month. Ratios were fine — arguably too fine. You were paying for coverage you didn't need.
The structural reason this keeps happening: revenue is variable and moves daily. Payroll is semi-fixed and moves slowly, because you can't cut a teacher's hours the same week a family gives notice without wrecking morale and coverage. The lag between revenue dropping and payroll adjusting is where the shortfall lives.
A single-scenario forecast makes this worse. If your budget assumes 90% occupancy all year and reality is a lumpy 82–94%, you're overstaffed in the soft months and scrambling in the full ones. The fix isn't a better guess at one number. It's modeling three futures and deciding — in advance — what you'll do at each.
One pattern worth noticing: centers that get surprised by payroll almost always staff off last month's headcount. Centers that don't get surprised staff off next month's projected enrollment. Same data, opposite direction.
The three-scenario spine: baseline, downside, upside
Every forecast in this model runs three columns side by side. Not because you'll hit exactly one of them, but because the spread shows you where the risk sits and which levers to pull.
Eliminate administrative bottlenecks.
Carexly helps you manage enrollments, attendance, and staff schedules effortlessly.
- Streamlined child enrollment
- Automated parent notifications
- Staff shift and activity scheduling
No credit card required
Baseline is your realistic expectation given known enrollments, known departures, and normal seasonal movement. Not your optimistic number. A lot of owners quietly inflate baseline because planning for less feels defeatist. Resist that. Baseline should be the number you'd actually bet money on.
Downside assumes the soft stuff goes wrong: a couple of unexpected withdrawals, a slower-than-usual intake, one classroom that doesn't fill. In practice this tends to cluster — families leave for the same reasons in the same season, so downside months bunch together rather than spread evenly across the year.
Upside is a genuinely full center, waitlist converting cleanly, low churn. It matters because upside creates its own problem: you need staff you may not have hired yet, and hiring lag can cost you enrollments if you can't accept kids you technically have room for.
Worked example for a medium center with licensed capacity of 96:
| Scenario | Avg Occupancy | Enrolled (of 96) | Monthly Tuition Revenue | Required Teaching FTE | Est. Monthly Payroll |
|---|---|---|---|---|---|
| Downside | 76% | ~73 | ~$124k | 15 | ~$95k |
| Baseline | 86% | ~83 | ~$141k | 17 | ~$107k |
| Upside | 94% | ~90 | ~$153k | 18 | ~$114k |
Notice payroll doesn't scale as cleanly as revenue. Between downside and baseline, revenue jumps roughly $17k but payroll only about $12k — because ratios let you absorb some enrollment growth into existing classrooms before you need another adult. That non-linear relationship is exactly what a spreadsheet handles well and mental math handles badly.
Staffing triggers: the rules that make the forecast act
A scenario table is just wallpaper until you attach triggers to it. A trigger is a pre-decided action tied to a threshold, so the decision is already made before the emotional moment arrives.
The mistake most centers make is triggering off total headcount. Total headcount hides the problem — you can sit at 86% overall while your infant room is at 60% and your pre-K room has a waitlist. Triggers have to live at the classroom level, tied to the ratio for that age group.
A trigger table structure that works for small and medium centers:
| Trigger Condition | Threshold | Action |
|---|---|---|
| Classroom drops below ratio efficiency | Room at <70% of staffed capacity for 2+ weeks | Consolidate rooms or reduce one shift; move floater |
| Classroom approaching full | Room at ≥90% with active waitlist | Post/approve hire before accepting next enrollment |
| Center-wide downside signal | 3+ withdrawal notices in one week | Freeze non-essential hours; reforecast next 60 days |
| Aging-up wave | 4+ kids transitioning rooms in a month | Rebalance FTE across affected rooms 3 weeks out |
| Upside confirmed | Occupancy ≥92% two months running | Approve permanent add to floater pool |
The two-week qualifier matters.
The two-week qualifier matters. Single-week dips are noise — a family vacation, a flu round, a snow closure. You don't want to cut a shift over noise and then rehire two weeks later. Triggers should fire on sustained movement, not a single bad week.
The connection to scheduling is where a lot of the real payroll leak happens. If your triggers say "reduce a shift" but your schedule templates aren't built to flex, nothing actually changes. This is the same coverage-and-utilization problem covered in the ratio-based approach to schedule gaps that break ratios and inflate payroll — triggers tell you when to move, templates give you how.
Tuition sensitivity: how much room your pricing actually gives you
Occupancy isn't the only variable moving your forecast — tuition does too, and the two interact in ways that aren't always obvious. A center running on thin margins reacts violently to occupancy dips because there's no pricing cushion. A center with a little headroom in tuition can ride out a soft quarter without touching staff.
Sensitivity analysis just means: for every dollar of tuition and every point of occupancy, how much does monthly contribution move? You build it by holding one variable and flexing the other.
A typical example: a center at 84% occupancy charging an average of $1,450/month per child. Drop occupancy 4 points and you lose roughly 3–4 enrollments and about $5k–$6k in monthly revenue. Now hold occupancy and raise average tuition 4% instead. That's roughly $58 per child, which on ~80 kids recovers close to the same amount. The insight isn't "raise prices." It's that a modest pricing adjustment can offset a meaningful occupancy dip — but only if you know the ratio in advance instead of reacting in a panic after the fact.
-
Rows
occupancy at 76%, 80%, 84%, 88%, 92%
-
Columns
average tuition at current, +2%, +4%, +6%
-
Each cell
projected monthly contribution after payroll
When you can see the full grid, downside months stop feeling like emergencies. You already know that 80% occupancy is survivable at current pricing, but 76% needs either a room consolidation or a tuition adjustment. The decision is pre-made.
One caution: tuition changes are slow-acting. You can't adjust prices month-to-month to chase enrollment swings. Sensitivity analysis is for setting your annual pricing posture and knowing your floor — not for tinkering in real time.
The monthly reconciliation ritual
Forecasts rot without a ritual. The most common reason a scenario model stops working is that nobody compares it back to reality, so drift accumulates quietly until the variance is too big to fix. Reconciliation is the maintenance step that keeps the system honest.
Run it the same day every month — right after payroll closes, because that's when both revenue and labor cost are finally real numbers, not estimates. Once the process is set up, it takes 30–45 minutes.
-
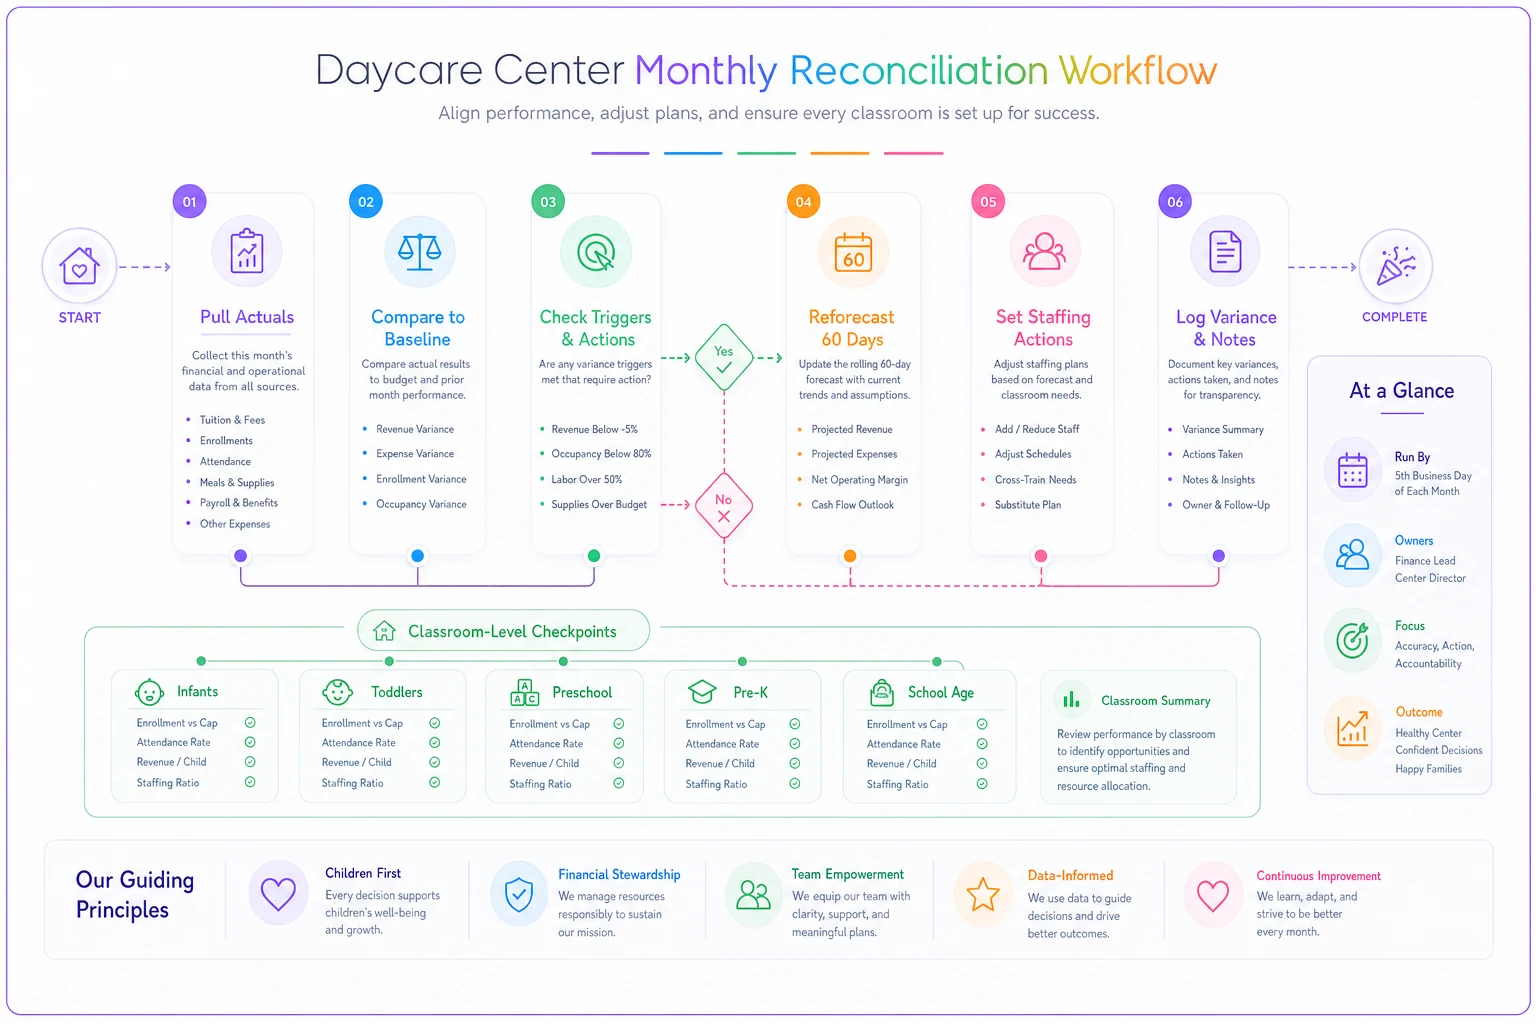
Pull actuals. Enrolled headcount by classroom, actual tuition collected, actual payroll including overtime and floaters. Not estimates — closed numbers.
-
Compare to baseline. Line up actual occupancy against your baseline projection for that month. Note the variance per classroom, not just center-wide.
-
Check which triggers fired — and whether you acted. This is the step everyone skips. Did a room sit below threshold for two weeks and nothing changed? That's your payroll leak, documented.
-
Reforecast the next 60 days. Update baseline/downside/upside using the withdrawals and enrollments you now actually know about.
-
Set staffing actions for next month. Based on the reforecast and triggers, decide shift changes now — while there's still time to communicate them without chaos.
-
Log the variance. Keep a running record. After a few months, patterns emerge: your baseline consistently runs 3 points optimistic, or your downside never materializes, and you calibrate accordingly.
Here's a simple workflow for the monthly reconciliation ritual.
That last step compounds. A center that logs variance for a year ends up with a forecast tuned to its own actual behavior, which is worth more than any generic industry benchmark.
The whole ritual depends on clean labor data going in. If your timekeeping is messy — floaters not coded to the right room, overtime buried in a lump — you're comparing garbage to a forecast. The classroom timekeeping and payroll-export discipline covered in avoiding payroll errors with export-ready templates is basically the data foundation this ritual sits on.
A real scenario: the medium center that stopped guessing
A center licensed for about 100 kids, running roughly 84% occupancy, kept ending random months $6k–$9k short on payroll relative to what leadership expected. Nothing dramatic — just enough to erase the buffer and stress the owner every quarter.
When they mapped the three scenarios and logged variance for a few months, the pattern was almost embarrassingly simple. Their infant and young-toddler rooms churned every late spring as parents shifted to summer arrangements, dropping those rooms to around 65% for about eight weeks. But staffing never moved, because the center-wide number still looked healthy at 82%. They were paying full coverage for two half-empty rooms every summer.
Once they attached a room-level trigger — consolidate the two soft rooms for the summer window and reassign a teacher to the floater pool — the payroll drag dropped by roughly $5k–$7k a month across that stretch. Nothing about the kids' care changed. Ratios stayed compliant. The only thing that changed was that a decision got made three weeks earlier than it used to.
The owner's framing stuck with me: they weren't spending too much, they were spending on the wrong month's enrollment.
When this model makes sense — and when it's overkill
This full three-scenario, triggered, reconciled system is built for centers where payroll is your largest cost and occupancy genuinely swings. That's most licensed centers above roughly 40 kids.
When it's worth it: you have multiple classrooms with different age groups that fill and empty at different rates, seasonal churn, and a payroll number big enough that a few points of occupancy meaningfully changes your month. If you've ever been surprised by payroll, you're in this group.
When it's overkill: a very small home-based or micro-center with one or two rooms and stable, near-full enrollment. If you're at 95%+ year-round with a waitlist and one classroom, three scenarios is more spreadsheet than your reality needs.
Who should wait: brand-new centers in their first ramp. Your enrollment is still finding its shape, so scenarios built on no history are just guesses stacked on guesses. Run the reconciliation ritual for six months first to build real data, then layer the scenarios once you have actual churn and seasonal patterns to model.
Where software earns its keep
None of this requires software — the model runs fine in a spreadsheet, and starting there is actually the right call so you understand the mechanics before automating them. But two parts get painful by hand as a center grows.
The first is trigger monitoring. Manually checking every classroom against its ratio threshold every week, across an aging-up wave, is exactly the kind of task that quietly stops happening when things get busy. An operational platform that watches room-level occupancy and flags when a room has sat below threshold for two weeks turns the trigger from "something someone should notice" into something that surfaces on its own. That's the difference between a trigger that actually fires and one that exists only on paper.
The second is the reconciliation data pull. When enrollment, tuition, and timekeeping all live in one system, the monthly ritual goes from an hour of exporting and stitching spreadsheets to a few minutes of reviewing numbers that are already lined up. The value isn't the automation for its own sake — it's that a ritual taking five minutes actually gets done every month. A ritual requiring an hour of data wrangling quietly gets skipped in the busy season, which is exactly when you need it most.
Pulling it together
Surprise payroll shortfalls are almost always a timing problem in disguise — payroll reacting to last month's enrollment while revenue already moved on. The three-scenario model fixes the timing by deciding in advance what happens at each occupancy level. Trigger tables turn those decisions into actions that fire at the classroom level, where the actual leakage hides. The sensitivity grid shows how much pricing headroom you have before staffing has to move. And the monthly reconciliation keeps everything calibrated to your center's real behavior instead of an optimistic assumption.
Build the spreadsheet first. Run reconciliation for a few months to learn your own patterns. Then tighten the triggers around what you actually see. Once occupancy and staffing are moving as one connected system instead of two numbers that meet up too late, the surprises mostly disappear — not because you got lucky, but because you already knew what to do before the month started.
Surprise payroll shortfalls are almost always a timing problem in disguise — payroll reacting to last month's enrollment while revenue already moved on. The three-scenario model fixes the timing by deciding in advance what happens at each occupancy level. Trigger tables turn those decisions into actions that fire at the classroom level, where the actual leakage hides. The sensitivity grid shows how much pricing headroom you have before staffing has to move. And the monthly reconciliation keeps everything calibrated to your center's real behavior instead of an optimistic assumption.
Build the spreadsheet first. Run reconciliation for a few months to learn your own patterns. Then tighten the triggers around what you actually see. Once occupancy and staffing are moving as one connected system instead of two numbers that meet up too late, the surprises mostly disappear — not because you got lucky, but because you already knew what to do before the month started.
Ready to transform your daycare operations?
Join hundreds of daycare centers using Carexly to save time, improve communication, and enhance child care quality.